Have students consider the questions posed about the graph – the key being that it’s not just the gradient of a demand function that determines elasticity – the formula is %change in QD over % change in price. This can be written as:
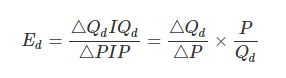
In the final equation, the left hand side is the gradient/slope of the line and the right hand side is where you are on the line. Therefore both parts are relevant.
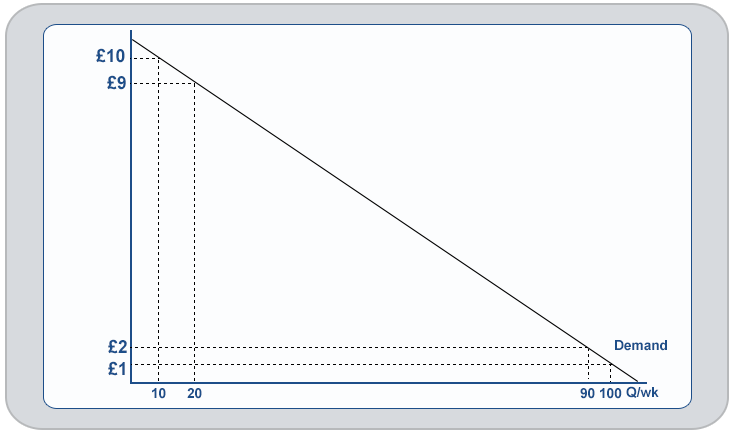
Calculate PED for:
- A fall in price from £10 to £9 and
- A fall in price from £2 to £1.
What’s going on?
Is this a surprise or is this what we should expect?